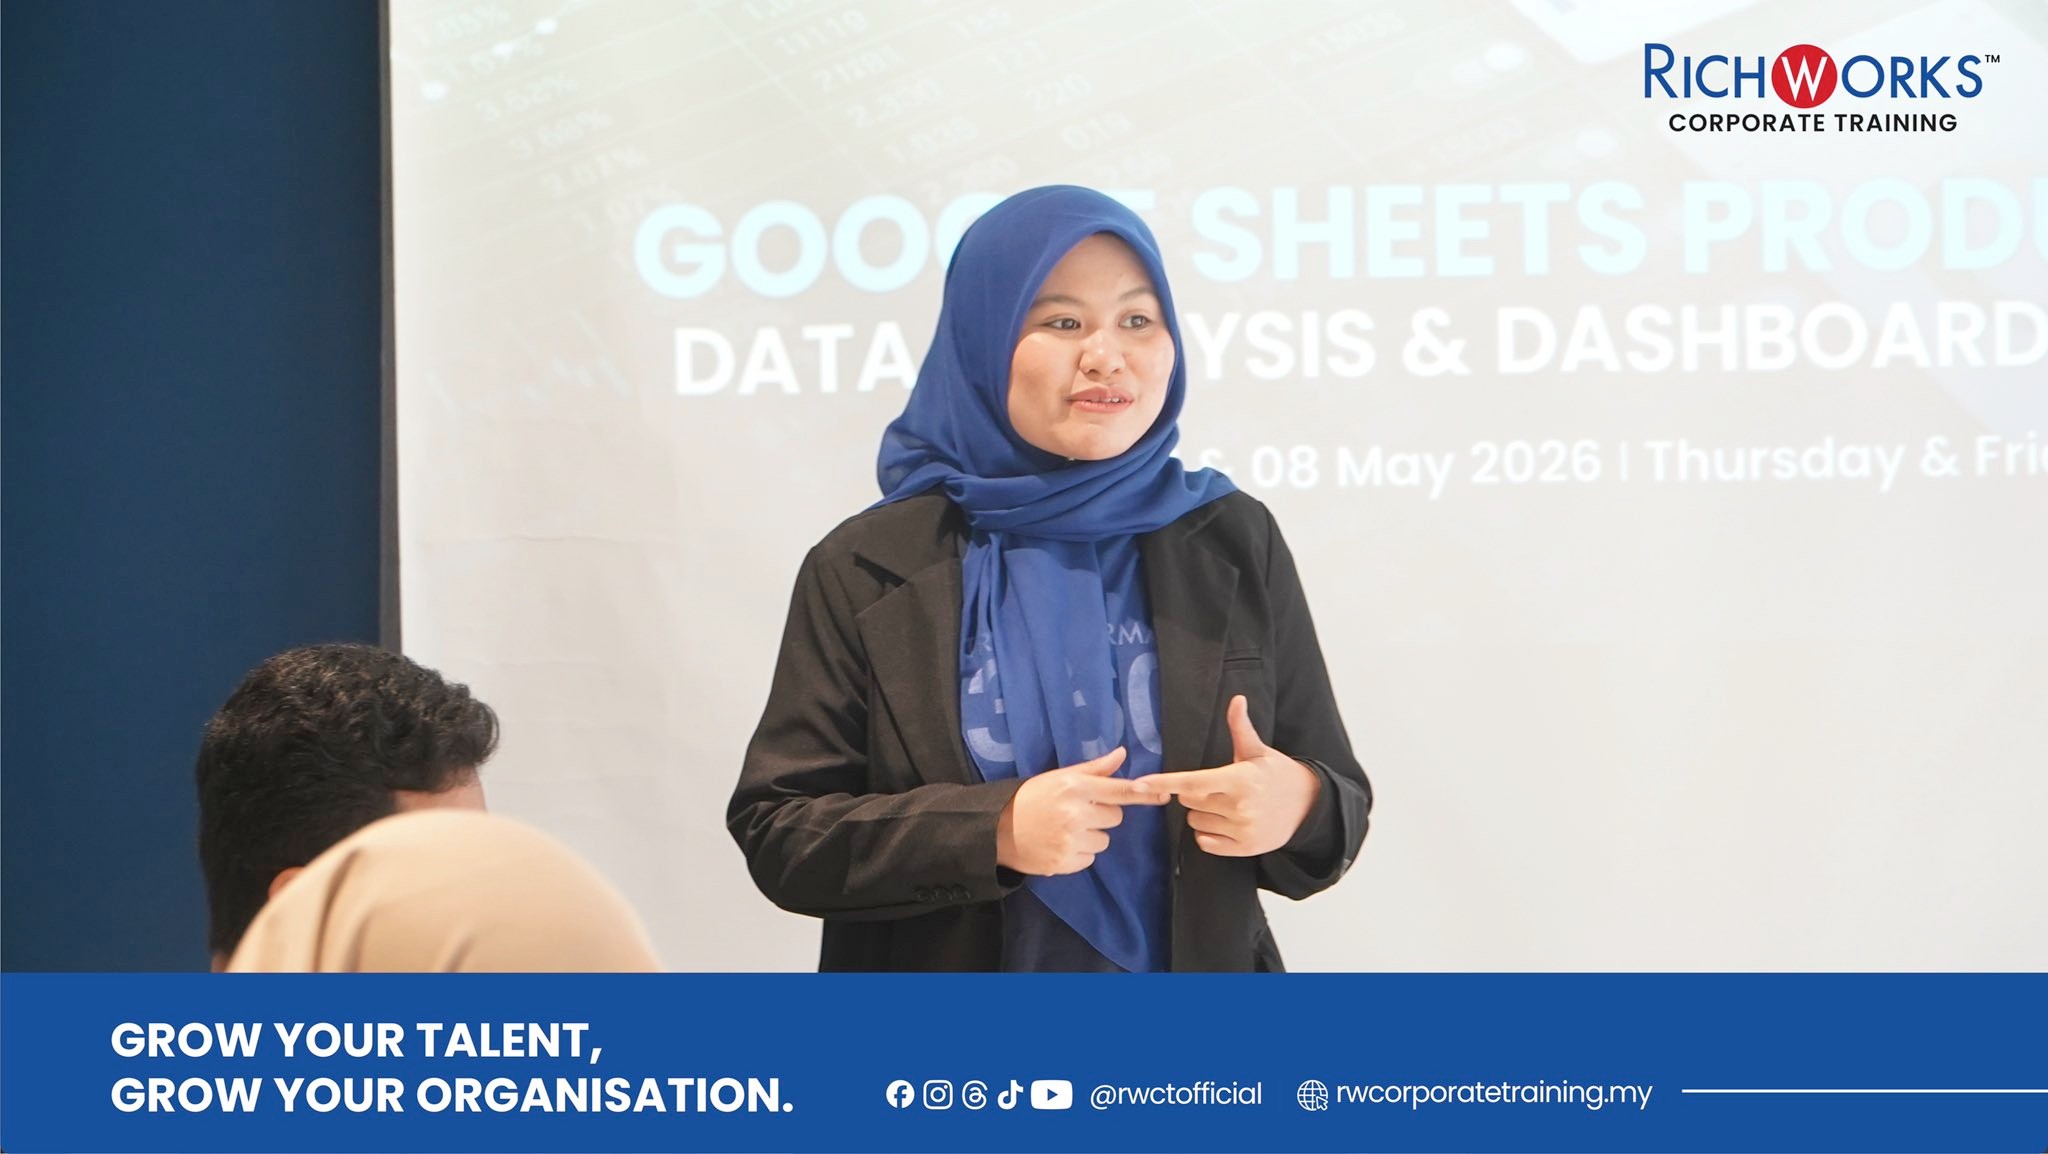
Google Sheets Productivity: Data Analysis & Dashboard Reporting
Mastering cloud-powered data analysis and interactive dashboard design to transform raw Google Sheets data into automated, executive-ready business insights.
9 – 10 December 2025
Program Overview
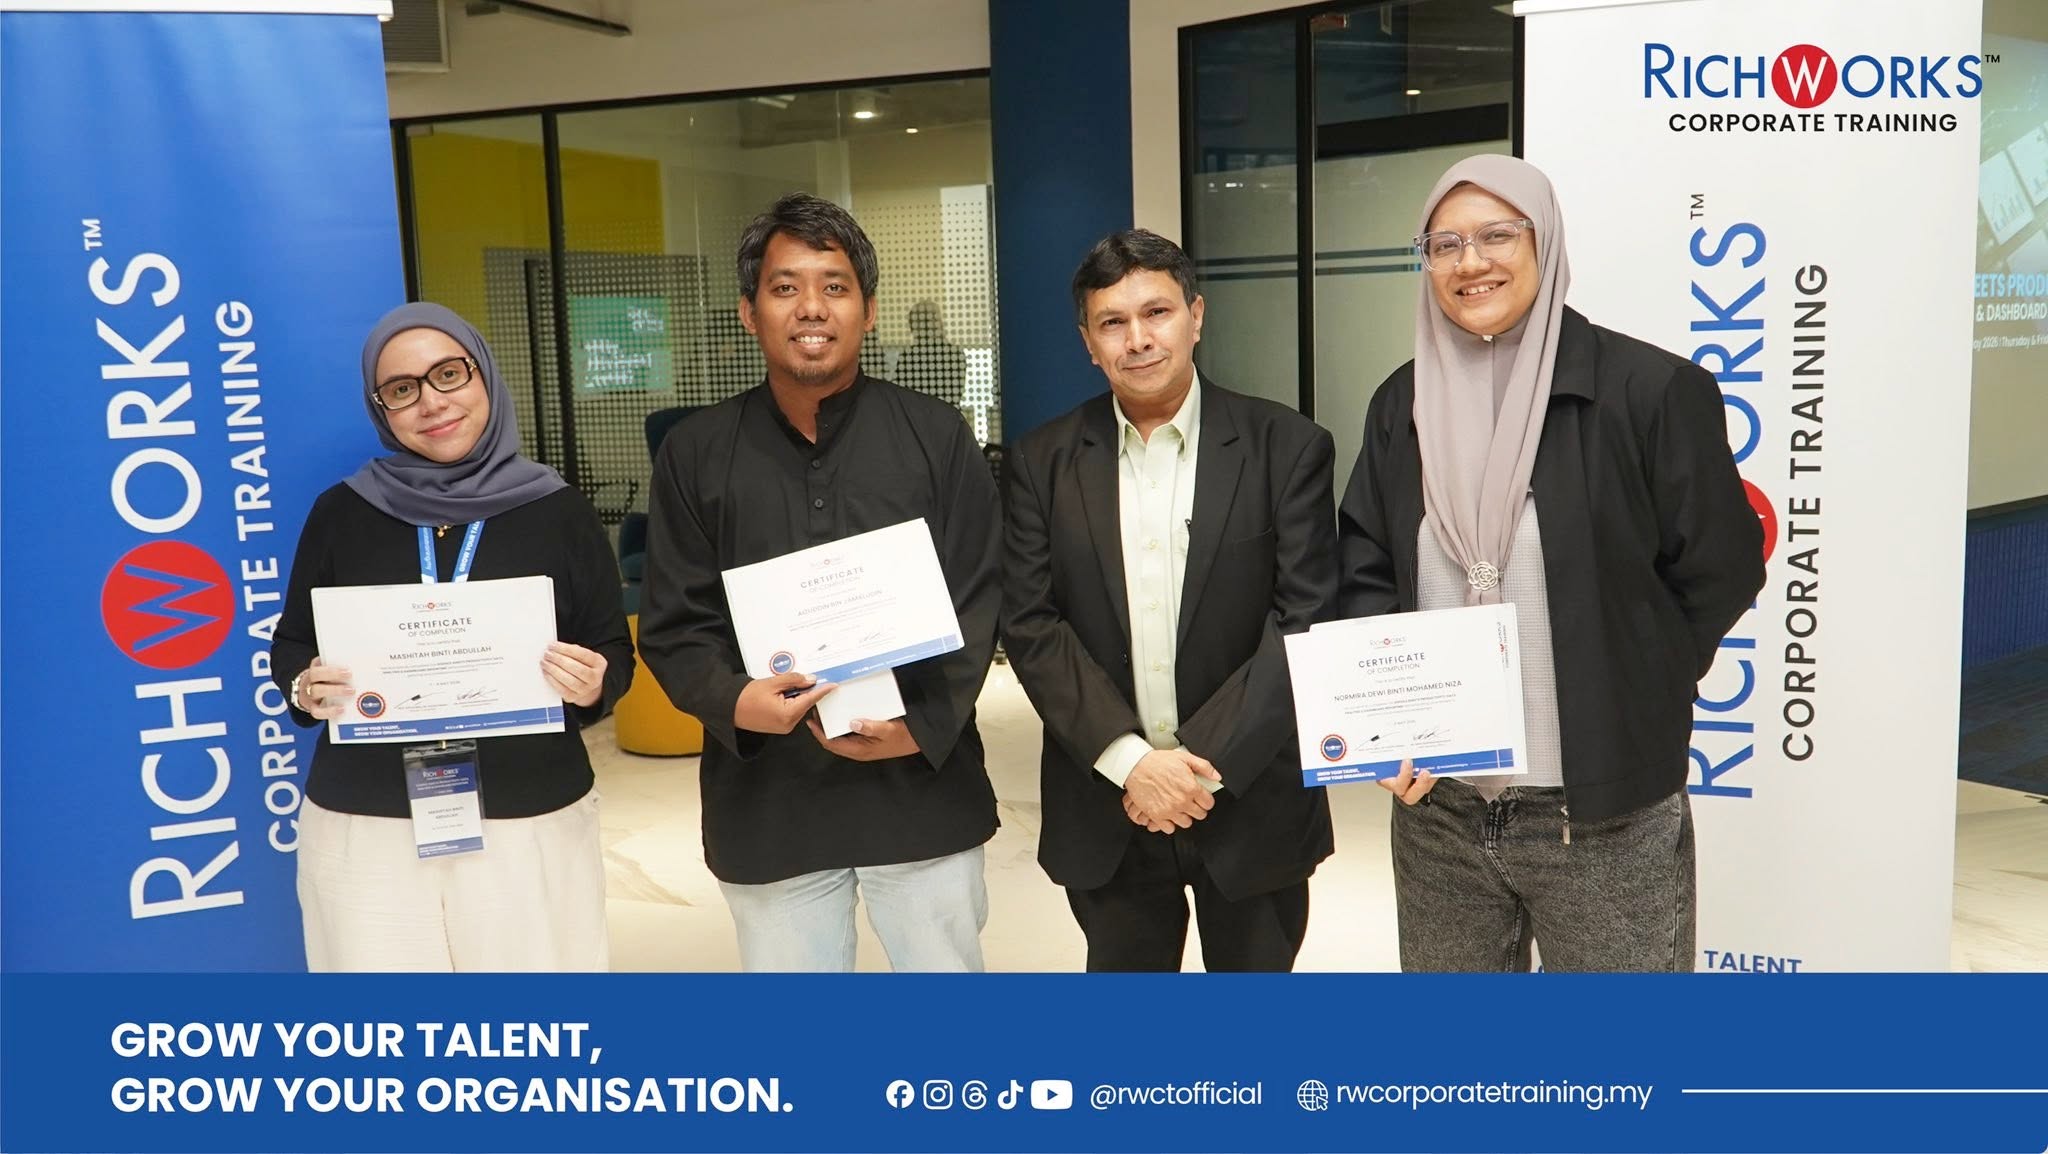
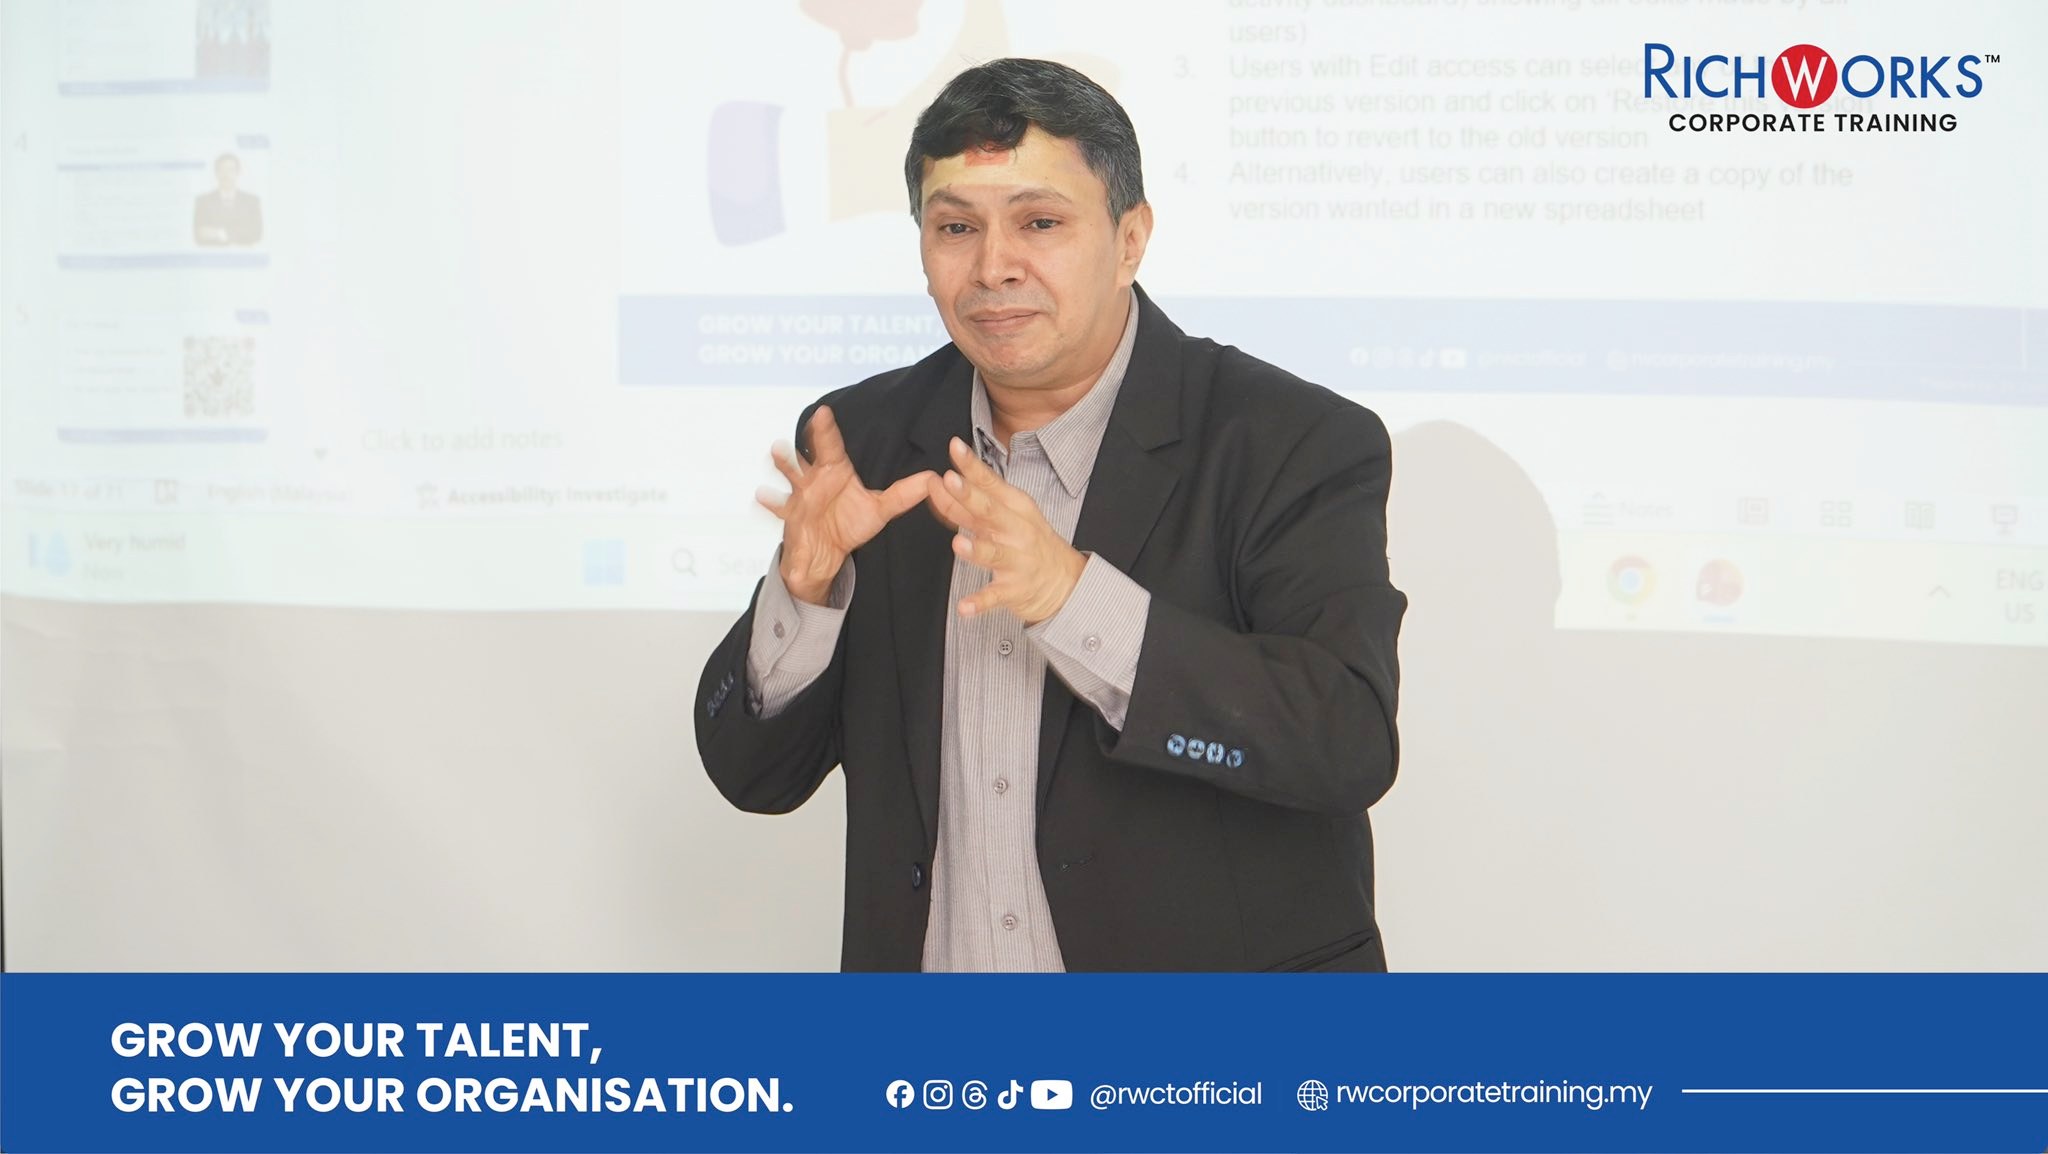
The Google Sheets Productivity: Data Analysis & Dashboard Reporting workshop is scheduled for 7–8 May 2026 at the tech-forward ThinkHub, I-City Shah Alam. Facilitated by the data expert Mr. Sh Zool Hilmy, this two-day intensive programme is designed to transform the way professionals interact with data moving beyond simple data entry into the realm of high-octane analysis and automated reporting.
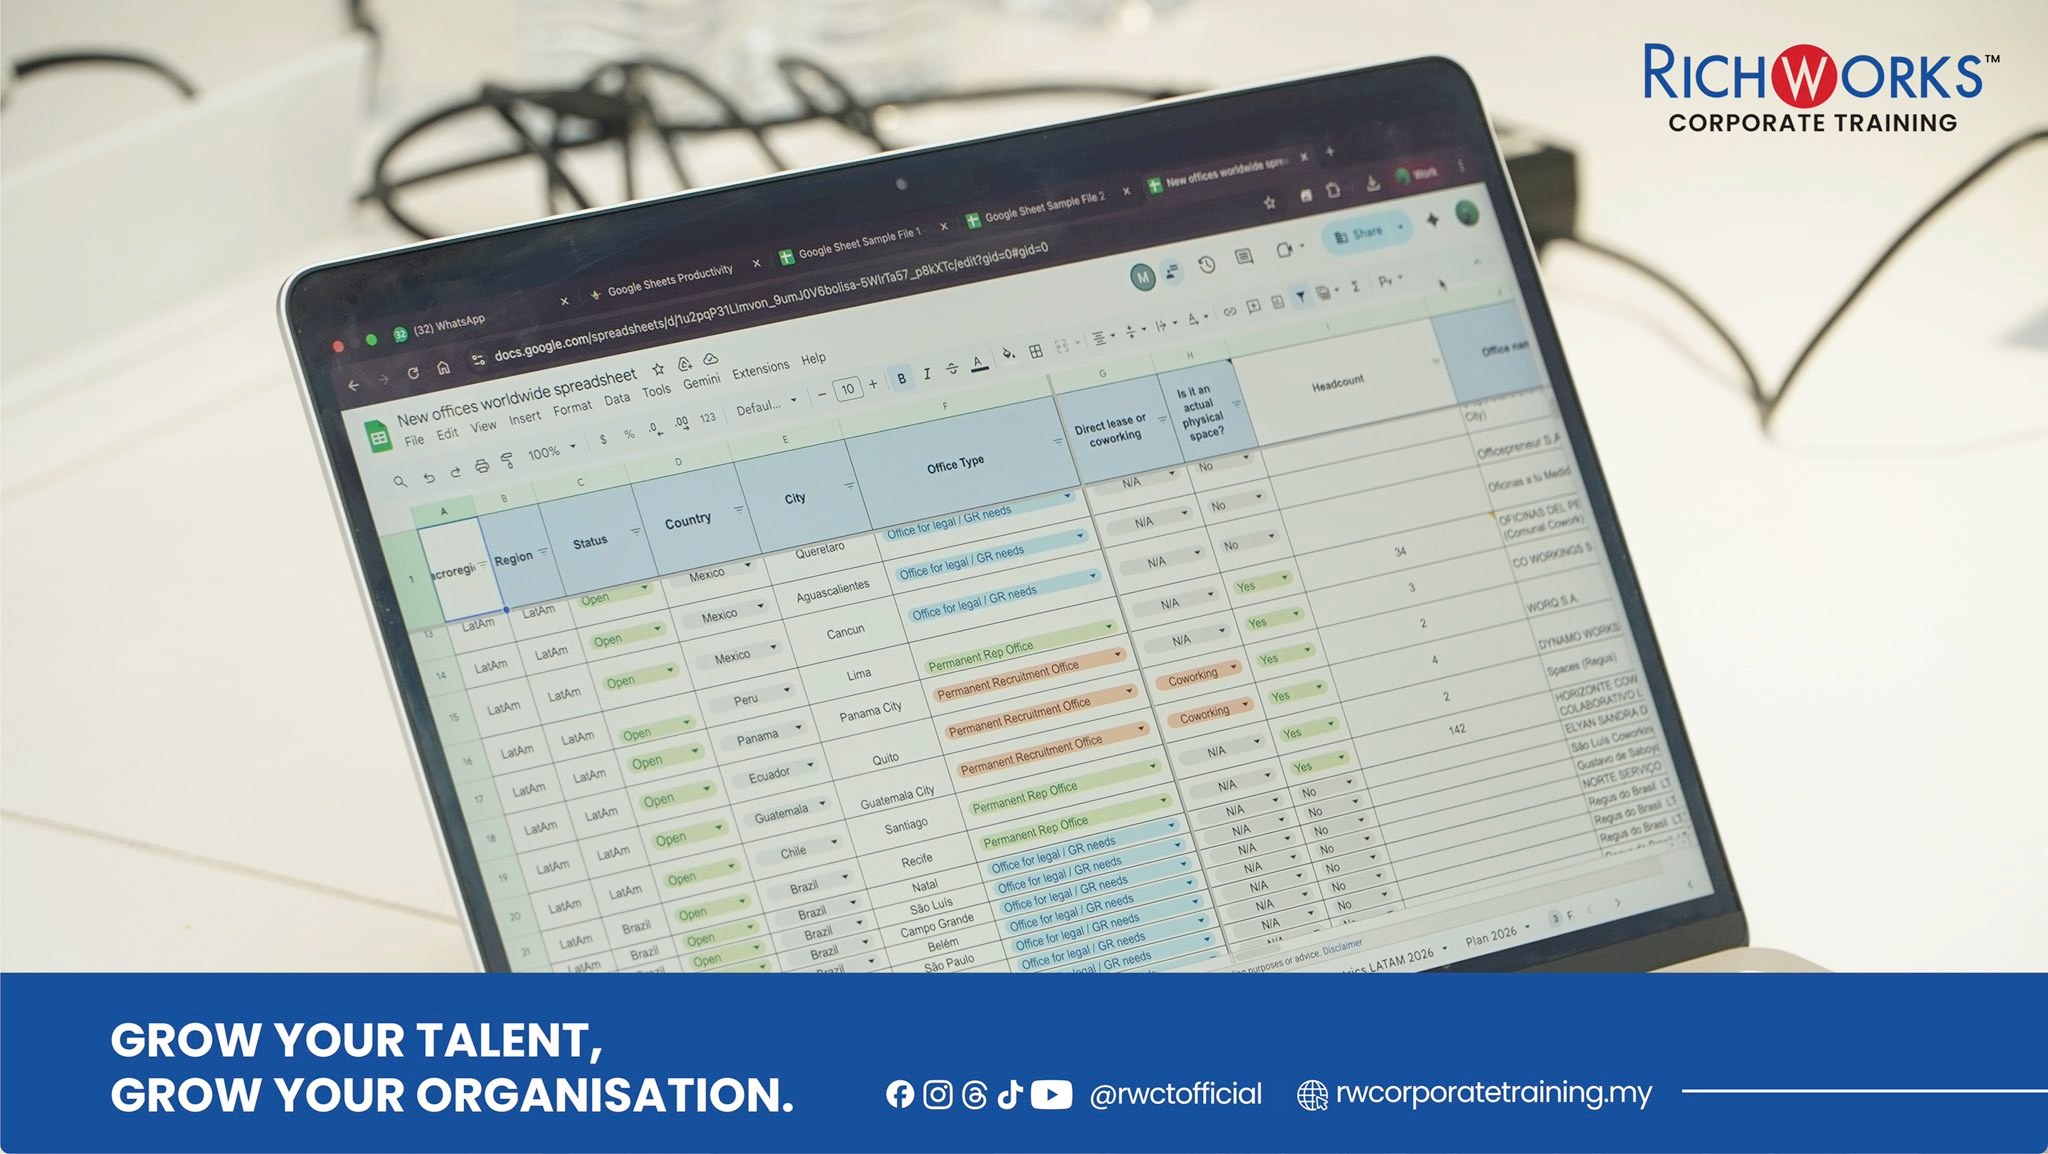
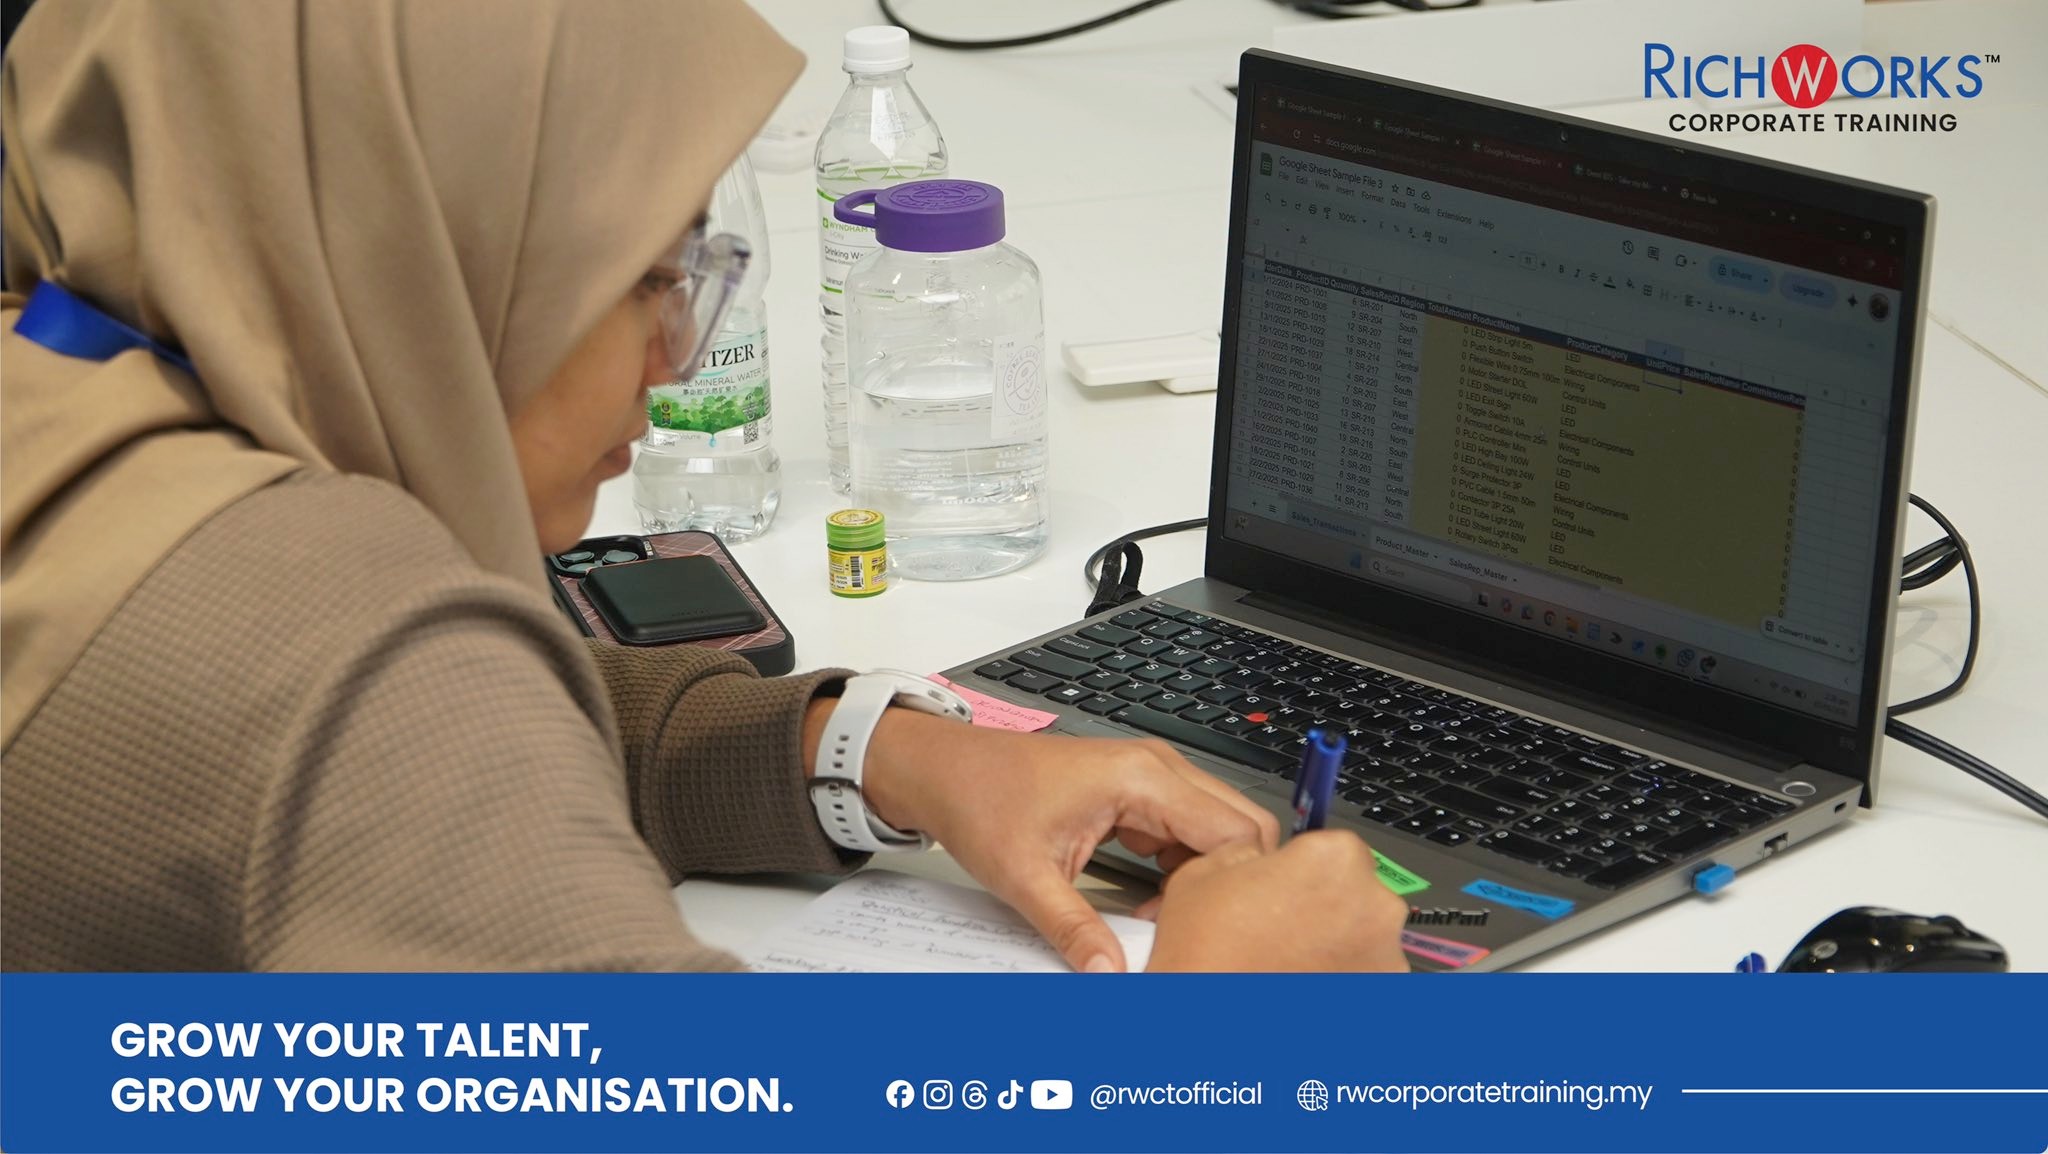
In today’s collaborative work environment, Google Sheets has become a powerhouse for real-time data management. This workshop provides a deep dive into the “spreadsheet vs. database” mindset, teaching participants how to build robust data models that are both clean and scalable. From mastering complex logical functions to designing interactive, management-ready dashboards, the focus is on turning raw numbers into clear, visual stories that drive strategic decision-making.
Key Learning Outcomes
- Efficiently clean and prepare raw data using advanced text and logic functions to ensure data integrity.
- Master complex lookups such as XLOOKUP and INDEX+MATCH for seamless multi-sheet data referencing.
- Perform structured analysis through the power of Pivot Tables and calculated fields.
- Design interactive dashboards utilizing slicers, dropdown controls, and dynamic ranges for user-driven reporting.
- Deliver high-impact visual stories that align with business KPIs and support executive-level decisions.
Programme Experience
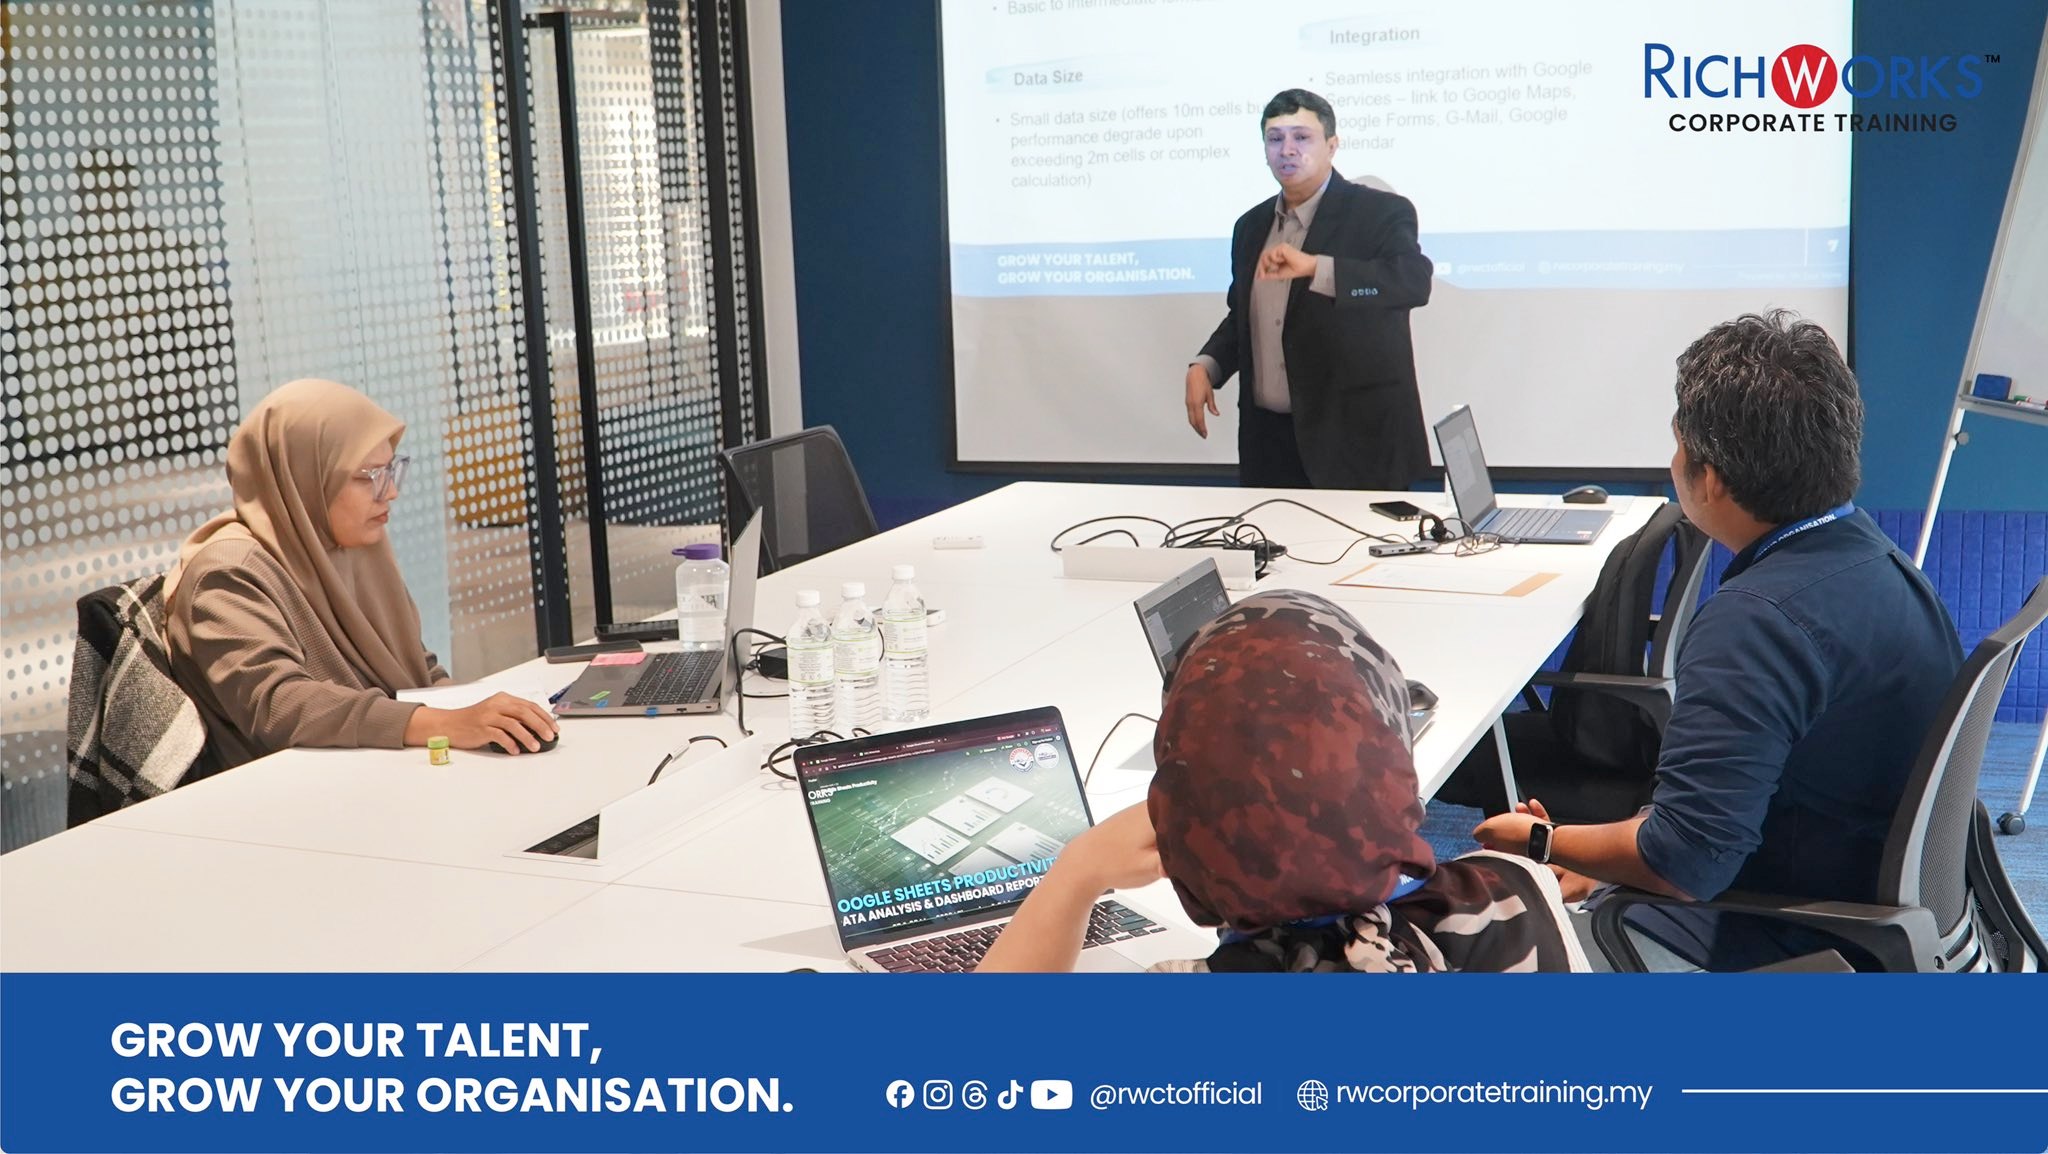
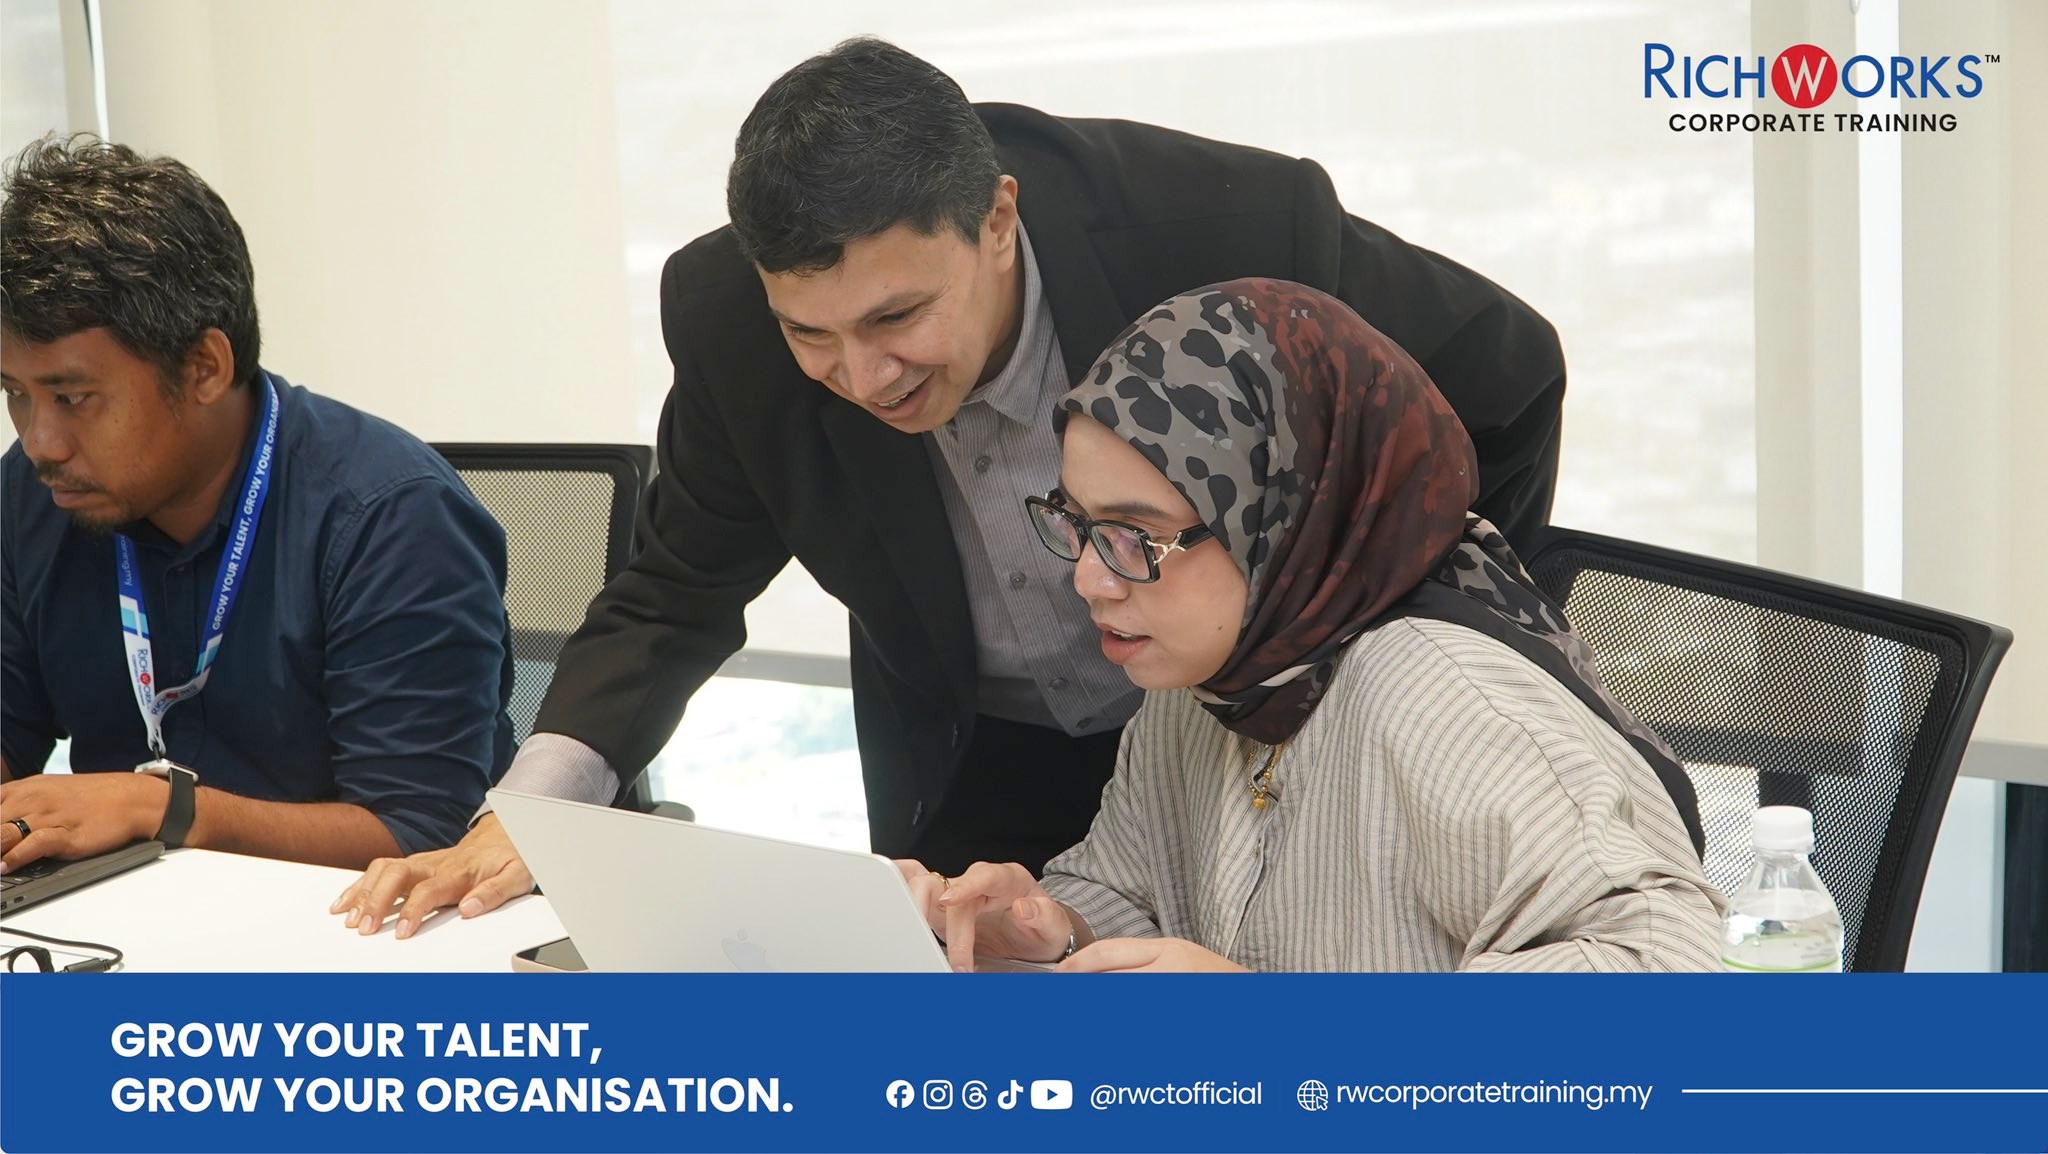
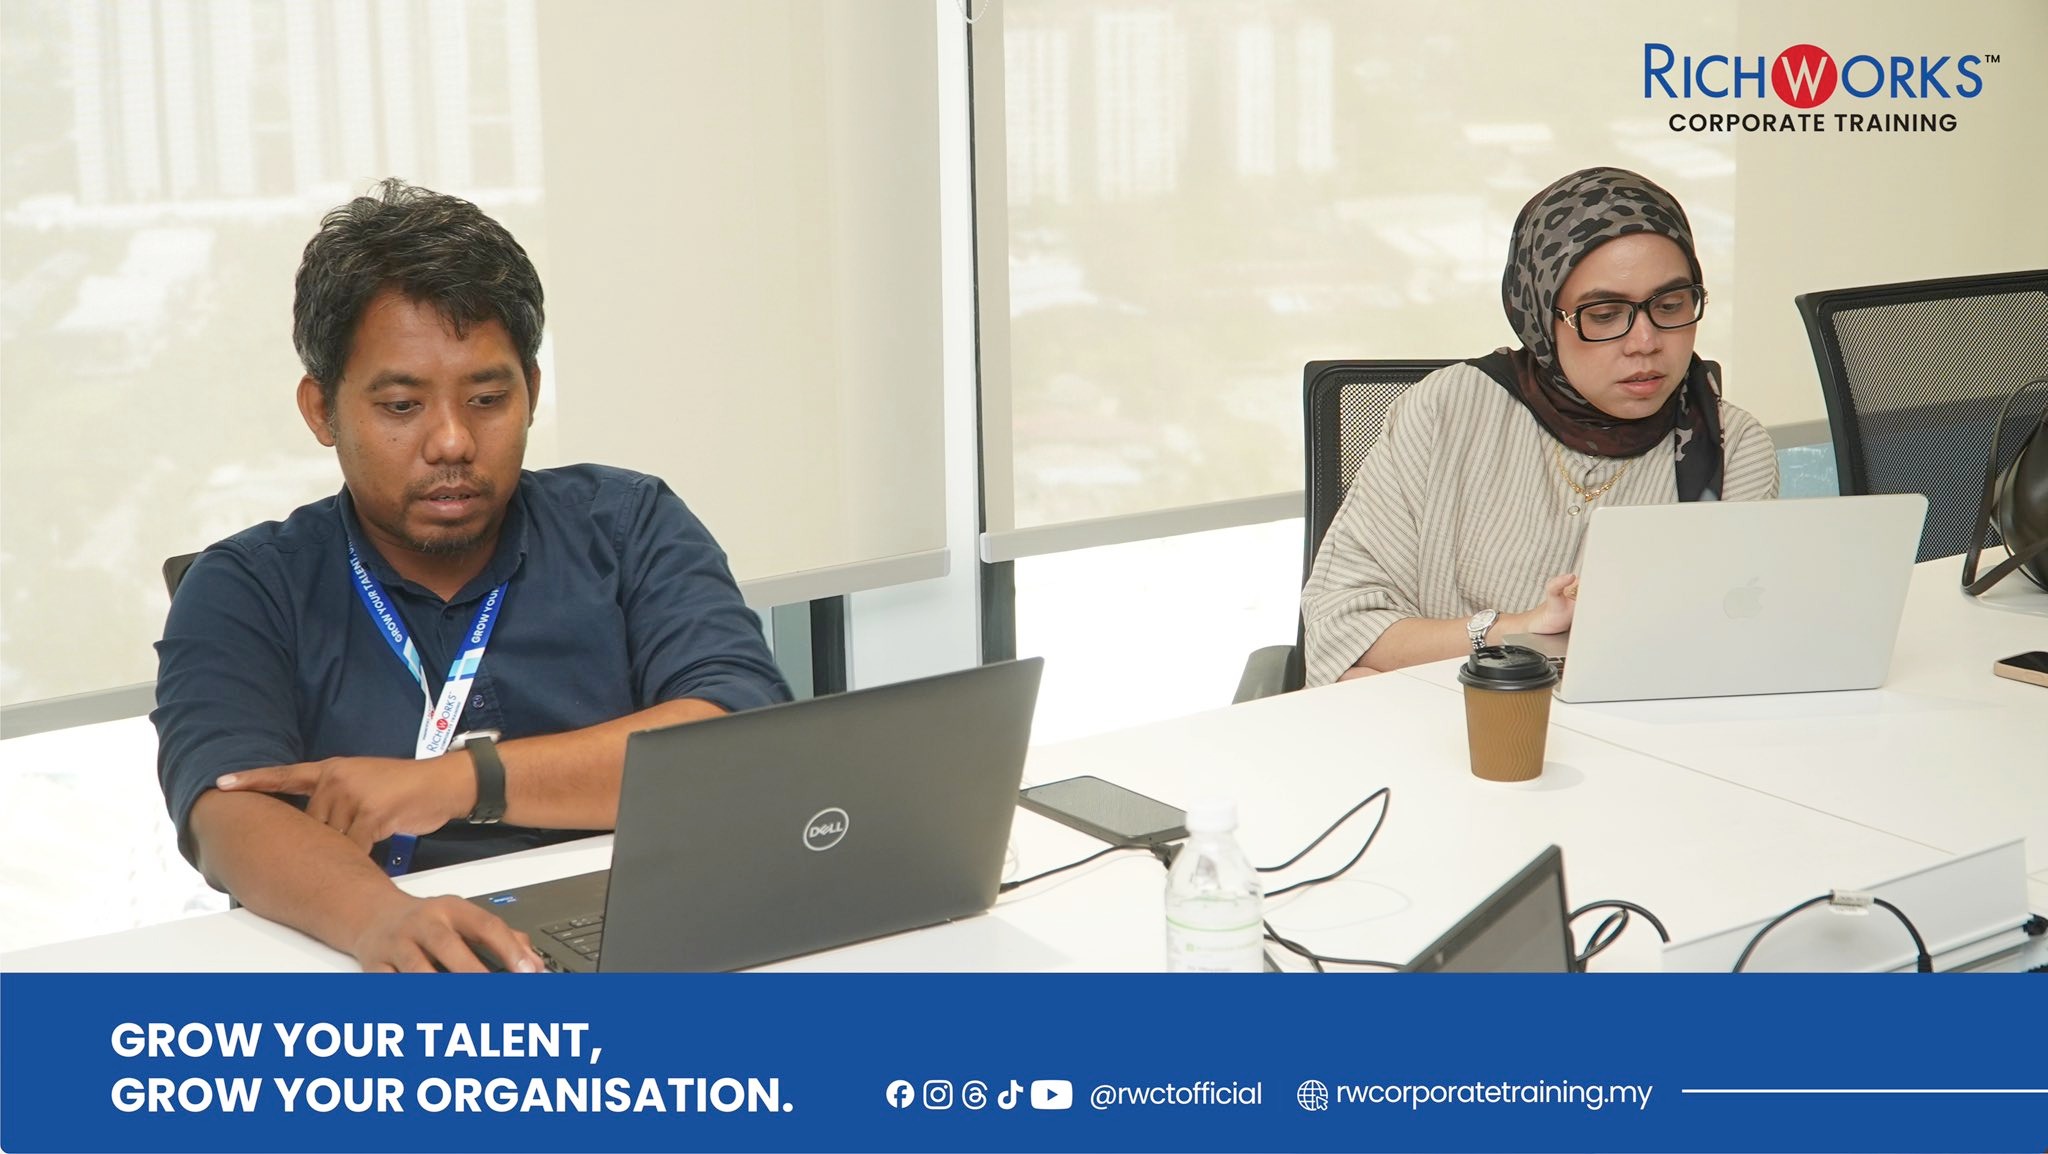
Set in the modern, collaborative environment of ThinkHub, the programme follows a logical progression from data foundations to visual mastery.
Day 1 is all about Foundations & Preparation. Mr. Sh Zool Hilmy guides participants through the “dirty work” of data cleaning, standardizing, and error-proofing datasets. Attendees explore the nuances of logic functions and date-time analysis, ensuring they have a rock-solid foundation before moving into advanced territory. The session focuses on building a workflow that minimizes manual errors and maximizes spreadsheet efficiency.
Day 2 transitions into Interactive Dashboards & Insight-Driven Reporting. This is where the magic happens. Participants learn to summarize massive datasets into meaningful Pivot Tables and translate those insights into compelling charts. The afternoon is dedicated to dashboard architecture, where attendees build interactive reports with filters and KPI cards. The workshop concludes with a focus on automation and collaboration, ensuring that the reports created are not only beautiful but also protected and easy to share across the organization.
Why Organisations Choose Richworks Corporate Training
Richworks Corporate Training delivers HRD Corp claimable programmes that focus on practical learning, regulatory clarity, and measurable workplace impact. Our training is designed to support organisations in developing competent, confident, and compliant teams guided by experienced facilitators with real industry exposure.